phenomenonA fact orevent thatcan beobservedrespirationthe processthat breaksdown food tomake cellenergyDecomposergets energyby eatingother alreadydeadorgansimsJanuary5thOur firstday backat school   ProducerMakes own foodusingsunlight/CO2/Waterbest forshowing dataabout parts ofa whole (likepercenatges)BioticlivingFree!datainformationcollected fromobservationand/ormeasurementecosystemall the livingandnonlivingparts of anenvironmentcompetitionwhen twoorganismstry to use thesameresourceBest forshowing howtwo variablesare related(change overtime)Grapha way ofdisplayingdata thatclearly showspatternsWhat weusually getinstead ofsnow inOregon    food weba diagram thatuses arrows toshow howenergy flows inan ecosystemGoogleClassroomSomethingyou won'thave to openuntil nextyear!    consumergets energyby eatingotherorganismsphotosynthesisthe processby whichproducersmake foodabioticnonlivingusually threestackedsnowballswith a facecarbohydratesFoodmoleculesmade byproducersquantitativedata frommeasurements(numbers)A very funway to getdown ahillfeedingrelationshipsa relationshipwhen oneorganism gainsenergy byeating anothercookieschocolatechip isone tastykindquestiona strongscience oneof these isspecific andtestablesymbiosisa longtermecologicalpartnershipBest forcomparingdata fromdifferentcategoriesCocoadelicious withmarshmallowsor whippedcreama beautifulice crystalthat fallsfrom the skyqualitativedata that isdescriptive(nonumbers)Habitat where anorganismlivesphenomenonA fact orevent thatcan beobservedrespirationthe processthat breaksdown food tomake cellenergyDecomposergets energyby eatingother alreadydeadorgansimsJanuary5thOur firstday backat school   ProducerMakes own foodusingsunlight/CO2/Waterbest forshowing dataabout parts ofa whole (likepercenatges)BioticlivingFree!datainformationcollected fromobservationand/ormeasurementecosystemall the livingandnonlivingparts of anenvironmentcompetitionwhen twoorganismstry to use thesameresourceBest forshowing howtwo variablesare related(change overtime)Grapha way ofdisplayingdata thatclearly showspatternsWhat weusually getinstead ofsnow inOregon    food weba diagram thatuses arrows toshow howenergy flows inan ecosystemGoogleClassroomSomethingyou won'thave to openuntil nextyear!    consumergets energyby eatingotherorganismsphotosynthesisthe processby whichproducersmake foodabioticnonlivingusually threestackedsnowballswith a facecarbohydratesFoodmoleculesmade byproducersquantitativedata frommeasurements(numbers)A very funway to getdown ahillfeedingrelationshipsa relationshipwhen oneorganism gainsenergy byeating anothercookieschocolatechip isone tastykindquestiona strongscience oneof these isspecific andtestablesymbiosisa longtermecologicalpartnershipBest forcomparingdata fromdifferentcategoriesCocoadelicious withmarshmallowsor whippedcreama beautifulice crystalthat fallsfrom the skyqualitativedata that isdescriptive(nonumbers)Habitat where anorganismlives

Science BING - Call List

(Print) Use this randomly generated list as your call list when playing the game. There is no need to say the BINGO column name. Place some kind of mark (like an X, a checkmark, a dot, tally mark, etc) on each cell as you announce it, to keep track. You can also cut out each item, place them in a bag and pull words from the bag.
1
2
3
4
5
6
7
8
9
10
11
12
13
14
15
16
17
18
19
20
21
22
23
24
25
26
27
28
29
30
31
32
  1. A fact or event that can be observed
    phenomenon
  2. the process that breaks down food to make cell energy
    respiration
  3. gets energy by eating other already dead organsims
    Decomposer
  4. Our first day back at school
    January 5th
  5. Makes own food using sunlight/CO2/Water
    Producer
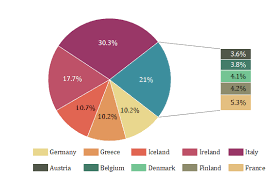
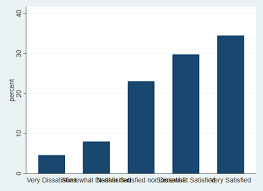
  6. best for showing data about parts of a whole (like percenatges)
  7. living
    Biotic
  8. Free!
  9. information collected from observation and/or measurement
    data
  10. all the living and nonliving parts of an environment
    ecosystem
  11. when two organisms try to use the same resource
    competition
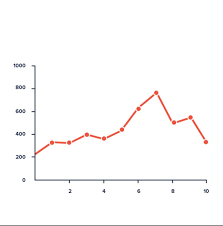
  12. Best for showing how two variables are related (change over time)
  13. a way of displaying data that clearly shows patterns
    Graph
  14. What we usually get instead of snow in Oregon
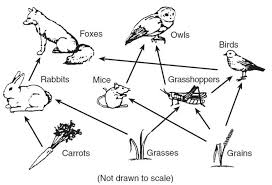
  15. a diagram that uses arrows to show how energy flows in an ecosystem
    food web
  16. Something you won't have to open until next year!
    Google Classroom
  17. gets energy by eating other organisms
    consumer
  18. the process by which producers make food
    photosynthesis
  19. nonliving
    abiotic
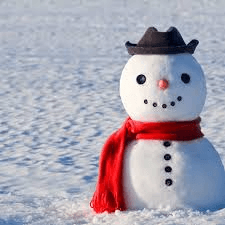
  20. usually three stacked snowballs with a face
  21. Food molecules made by producers
    carbohydrates
  22. data from measurements (numbers)
    quantitative
  23. A very fun way to get down a hill
  24. a relationship when one organism gains energy by eating another
    feeding relationships
  25. chocolate chip is one tasty kind
    cookies
  26. a strong science one of these is specific and testable
    question
  27. a long term ecological partnership
    symbiosis
  28. Best for comparing data from different categories
  29. delicious with marshmallows or whipped cream
    Cocoa
  30. a beautiful ice crystal that falls from the sky
  31. data that is descriptive (no numbers)
    qualitative
  32. where an organism lives
    Habitat